


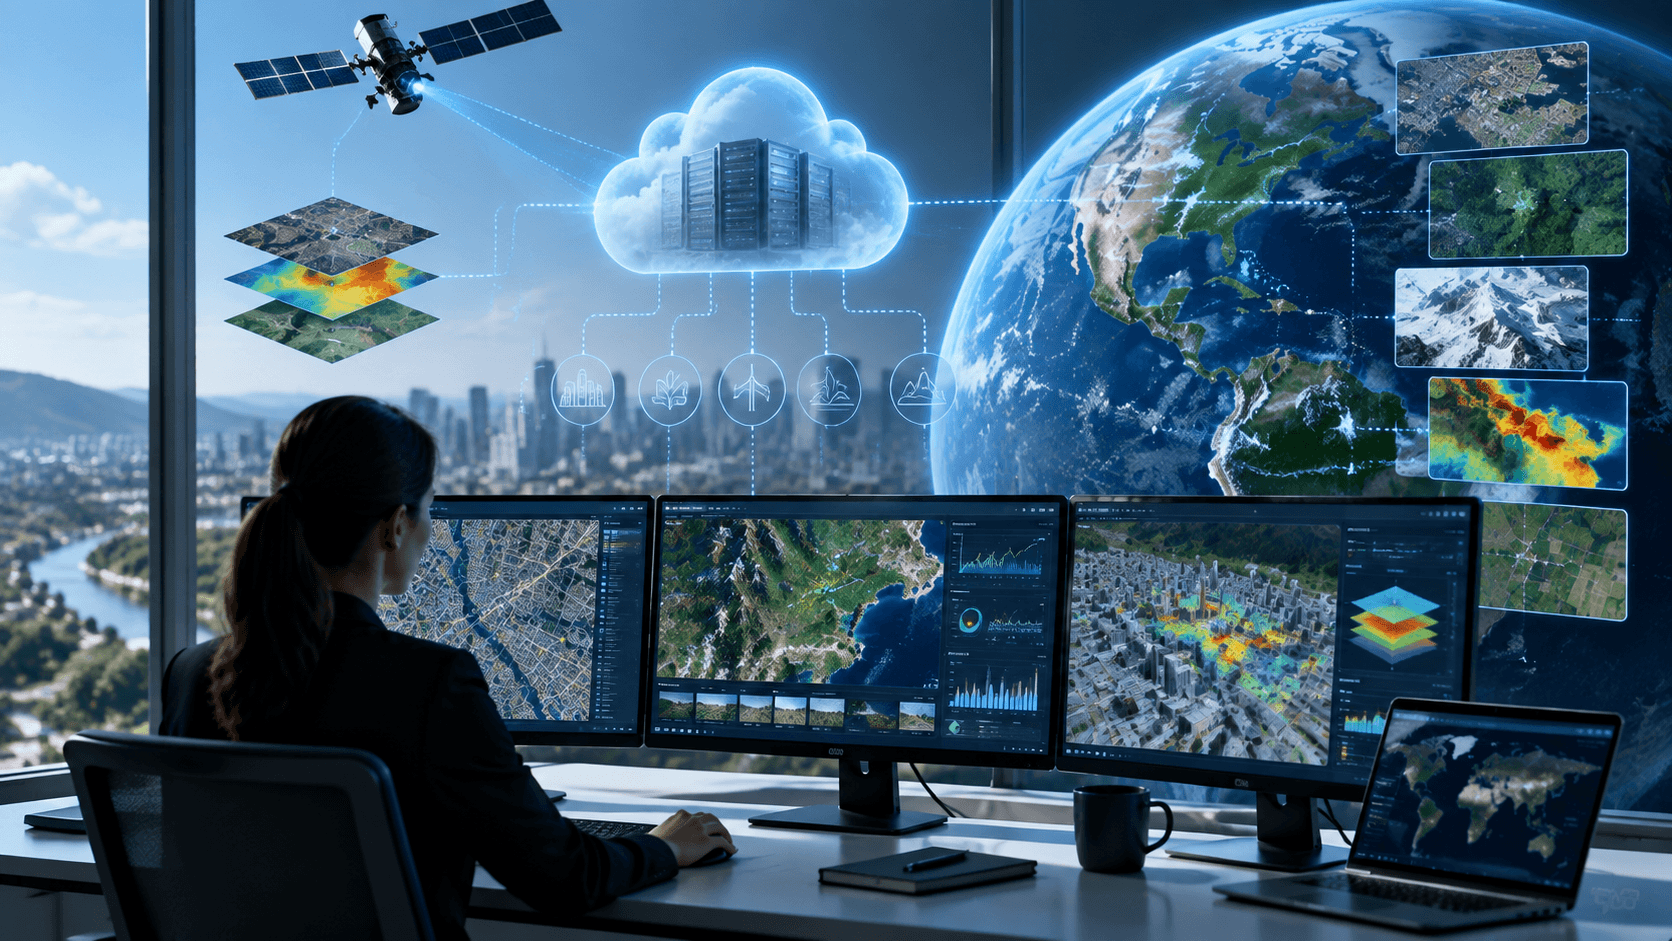

Cloud GIS combines geographic information systems (GIS) with cloud computing to store, manage and analyze spatial data. As geospatial applications expand across areas such as infrastructure, environmental monitoring, transportation and remote sensing, patent activity offers one way to examine where organizations are developing technology.
The STIMAnalytics Cloud GIS Patent Landscape Report analyzed 4,963 patent records related to Cloud GIS from 2010 to 2024. It examines patent activity over time, geographic distribution, technology areas and leading applicants.
Patent filings can indicate where organizations are seeking to protect inventions. They do not, by themselves, show whether a technology has been adopted, how well it performs or what share of a market a company holds.
Patent activity has grown since 2015
The report identifies a substantial increase in Cloud GIS patent activity over the period studied. It records 2023 as the peak year, with more than 700 patent filings, and reports that 88% of the analyzed records date from 2015 onward.
This pattern points to sustained innovation activity in Cloud GIS. It should be read as a patent trend, rather than a direct measure of product launches or commercial adoption.
Which technologies appear in the landscape?
The report identifies several broad areas of Cloud GIS innovation, including:
- Geospatial data processing and database structures
- Image analysis and remote sensing
- Real-time data analysis
- Machine learning and artificial intelligence
- Location-based services and navigation
- 3D visualization and modeling
- Big data integration
- Data security and privacy
Among the areas with the highest patent activity in the last five years of the study were information retrieval and database structures, image analysis, administration and management, navigation, and information and communication technology for specific business sectors.
These categories describe themes in the patent landscape. They do not necessarily represent individual products or technologies that are already in commercial use.
The United States and China lead patent activity
The United States accounts for the largest number of patent records in the report, with 3,398. China follows with 998. Together, the two countries represent approximately 88% of the analyzed records.
This concentration highlights the strong presence of US- and China-based patent activity in the Cloud GIS landscape. Patent counts reflect where applications were recorded; they should not be interpreted as market share or a complete measure of innovation in each country.
Which organizations are active in Cloud GIS patents?
The report identifies IBM as the leading patent applicant, with more than 116 patent applications. Google and Microsoft Technology Licensing LLC are also named among the leading applicants. The report’s broader discussion of key players includes HERE Global B.V.
These organizations have patent activity associated with areas such as geospatial data processing, image analysis, database structures and navigation. The report provides further detail on applicant activity and selected company patent portfolios.
What the findings mean for technology decision-makers
The patent landscape suggests that Cloud GIS innovation spans more than cloud infrastructure alone. Data management, image analysis, navigation, AI-related capabilities and integration with broader information systems also feature in the landscape.
For technology and strategy teams, patent analysis can help identify active organizations and areas for further investigation. It can inform questions about which technologies to monitor, which applicants may be relevant to follow and where additional technical or market research is needed.
Patent activity is one evidence source. It should be considered alongside product information, customer needs, technical validation and market analysis before making investment or partnership decisions.
About the report
The STIMAnalytics Cloud GIS Patent Landscape Report analyzes 4,963 patent records from 2010 to 2024. It covers patent activity trends, technology areas, geographic distribution and applicant activity.