Table of Content
Principais descobertas
Sumário executivo
1. Introdução
2. Visão geral do cenário de patentes
2.1. Análise de Família de Patentes
2.2. Cobertura do mercado de patentes
2.3. Jurisdição geográfica
2.4. Global Visual inspection based on AI applications activity
2.5. Global Visual inspection based on AI Distribution in Industries
3. Análise de mercado e concorrentes
3.1. Mercado em resumo
3.2. Participação de mercado dos principais produtores
3.3. Some of The Main Productions in Visual Inspection System Based On Ai
3.4. Principais candidatos
3.5. Analysis of Visual inspection patent leaders based on application
3.6. Top visual inspection applicants based on industry
3.7. Market Coverage of Top Applicants
3.8. Top Owners
3.9. Highly-Cited Applicants
3.10. Collaboration
3.10.1. Top Ten Applicants’ collaborations
3.10.2. The strongest cooperation networks
3.11. Top applicant activity
3.12. Pioneer companies in the last 5 years
3.13. Top applicant clustering
3.14. Pending patents
4. Análise de Tecnologia
4.1. Principais tecnologias
4.1.1. Visual inspection Patent Trends Across Industries
4.1.2. Top Technologies by Applications
4.1.3. Top Technologies by Class
4.1.4. Top Technologies by Sub-Class
4.1.5. Top Technologies by Main-Group
4.1.6. Top Technologies by Sub-Group
4.1.7. Top Technologies and Main Trends
4.2. Cinco tecnologias dominantes recentes
4.3. Patentes-chave
4.4. Os principais temas das patentes
4.5. Agrupamento de tecnologia
4.6. Principais inventores
5. Perfil de patentes dos principais participantes
5.1. COGNEX CORP
5.1.1. Company Overview
5.1.2. Patent family analysis
5.1.3. Top Products
5.1.4. Top Technologies
5.1.5. Collaborations
5.1.6. Merge and Acquisitions
5.1.7. Key patents
5.1.8. Topic modeling
5.1.9. Clustering
5.2. TRINAMIX GMBH
5.2.1. Company Overview
5.2.2. Patent family analysis
5.2.3. Top Processes
5.2.4. Top Technologies
5.2.5. Key patents
5.2.6. Topic modeling
5.2.7. Patents clustering
5.3. AUGUSTINE BIOMEDICAL DESIGN LLC
5.3.1. Company Overview
5.3.2. Patent family analysis
5.3.3. Top Products
5.3.4. Top Technologies
5.3.5. Key patents
5.3.6. Topic modeling
5.3.7. Patents clustering
5.4. BOEING CO
5.4.1. Company Overview
5.4.2. Patent family analysis
5.4.3. Top Products
5.4.4. Top Technologies
5.4.5. Collaborations
5.4.6. Merge and Acquisitions
5.4.7. Key patents
5.4.8. Topic modeling
5.4.9. Clustering
5.5. VERENIUM CORP
5.5.1. Company Overview
5.5.2. Patent family analysis
5.5.3. Top Technologies
5.5.4. Collaborations
5.5.5. Merge and Acquisitions
5.5.6. Key patents
5.5.7. Topic modeling
5.5.8. Clustering
5.6. GEN ELECTRIC
5.6.1. Company Overview
5.6.2. Patent family analysis
5.6.3. Top Processes
5.6.4. Top Technologies
5.6.5. Collaborations
5.6.6. Merge and Acquisitions
5.6.7. Key patents
5.6.8. Topic modeling
5.6.9. Clustering
5.7. INSPEKTO A M V LTD
5.7.1. Company Overview
5.7.2. Patent family analysis
5.7.3. Top Products
5.7.4. Top Technologies
5.7.5. Collaboration
5.7.6. Merge and Acquisitions
5.7.7. Key patents
5.7.8. Topic modeling
5.7.9. Collaborations
5.8. HUNTER ENG CO
5.8.1. Company Overview
5.8.2. Patent family analysis
5.8.3. Top Products
5.8.4. Top Technologies
5.8.5. Collaboration
5.8.6. Merge and Acquisitions
5.8.7. Key patents
5.8.8. Topic modeling
5.8.9. Clustering
5.9. IBM
5.9.1. Company Overview
5.9.2. Patent family analysis
5.9.3. Top Products
5.9.4. Top Technologies
5.9.5. Merge and Acquisitions
5.9.6. Key patents
5.9.7. Topic modeling
5.9.9. Clustering
5.10. AMGEN INC
5.10.1. Company Overview
5.10.2. Patent family analysis
5.10.3. Top Products
5.10.4. Top Technologies
5.10.5. Collaborations
5.10.6. Merge and Acquisitions
5.10.7. Key patents
5.10.8. Topic modeling
5.10.9. Clustering
Isenção de responsabilidade
Descrição
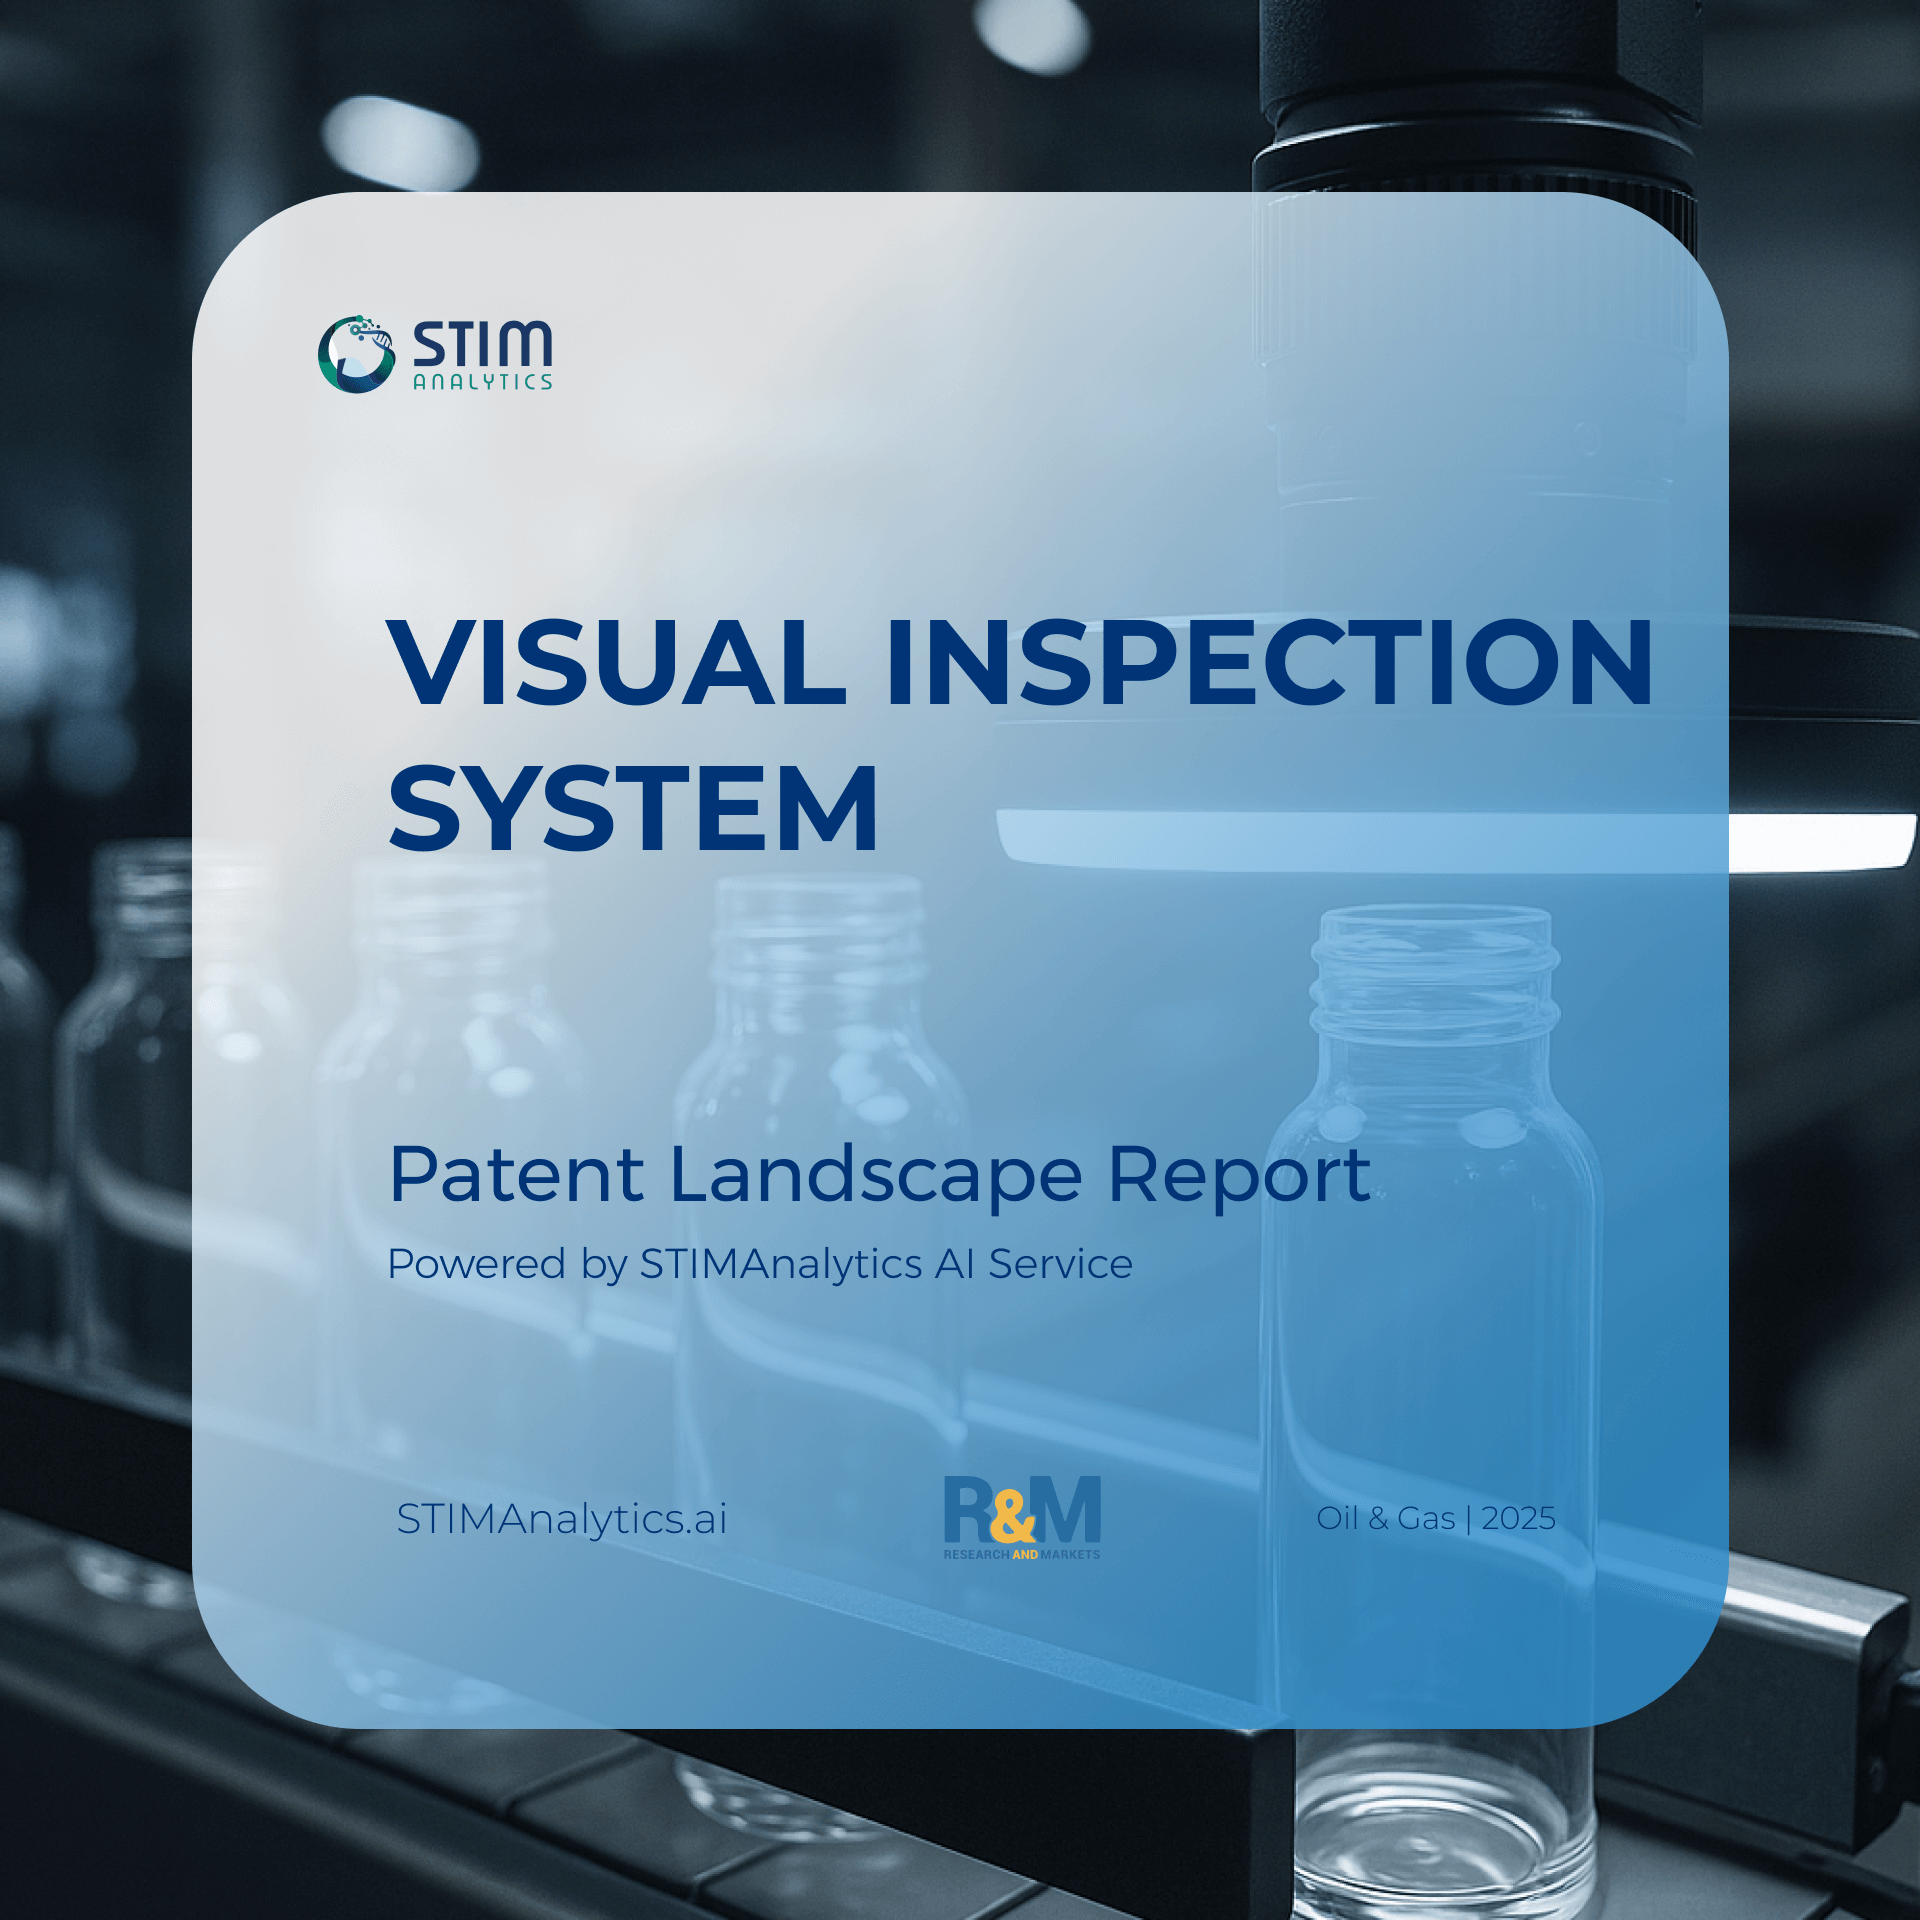
The Visual Inspection System Patent Landscape Report provides an in-depth patent landscape analysis, covering 5,433 patents from 2010 to 2024, collected across major global jurisdictions. This comprehensive dataset is derived from international patent filings and includes details on market trends, growth projections, and technology clustering, forming the basis for examining the evolution of AI-powered and automated visual inspection technologies. By integrating both quantitative and qualitative data, the report establishes a solid foundation for assessing patent applications, technological advancements, and market growth in the visual inspection systems sector. This multifaceted approach supports insights into current competitive positioning and potential areas for future expansion in industrial automation, manufacturing quality control, and defect detection applications.
The report is organized into key sections, each offering critical insights into various aspects of the visual inspection industry. The primary sections include the Patent Landscape Overview, Market and Competitor Analysis, Technology Analysis, and Key Players. Each section provides a unique viewpoint designed to support strategic decisions for research, investment, and competitive positioning within the visual inspection systems domain.
Visão geral da paisagem
The landscape overview presents a clear picture of patent activity in visual inspection technologies, tracing trends from 2010 to 2024. The analysis reveals significant growth in patent filings over the last decade, with rapid acceleration since 2016 and a peak in 2023. China and the United States lead globally in patent registrations, while Europe, Japan, and South Korea also show notable contributions. This strong growth trend reflects increasing adoption of AI and machine vision in manufacturing, logistics, electronics, automotive, and other high-precision industries.
Seção de Análise de Mercado
The market analysis section explores the commercial dimensions of the visual inspection systems sector, including global market value, deployment trends, and regional segmentation. The market was valued at approximately $9.5 billion in 2023 and is projected to grow at a CAGR of 7–9% through 2030. Key growth drivers include demand for high-speed defect detection, automation in manufacturing, and integration with industrial IoT and AI. The Asia-Pacific region leads in adoption, driven by electronics and semiconductor manufacturing, followed by North America and Europe. The overlap between high R&D activity and market demand is especially strong in sectors such as automotive quality control, electronics assembly, and food & beverage safety inspection.
Seção de Análise de Tecnologia
The technology analysis section reviews core innovation areas, such as AI-driven image processing, high-resolution camera systems, real-time defect detection algorithms, hyperspectral imaging, and 3D vision systems. Top IPC categories include G06T7 (image analysis), G01N21 (optical investigation), and B07C5 (sorting by optical means). Emerging trends include deep learning models for adaptive inspection, hybrid human-AI collaborative systems, and integration with robotic arms for automated handling and inspection. This section identifies the technology clusters and dominant patent themes that are shaping the next generation of inspection solutions.
Seção de Jogadores Top
The top player section offers insights into leading organizations in visual inspection innovation, such as Siemens AG, Intel Corporation, IBM, Keyence Corporation, Omron Corporation, Cognex Corporation, Trinamix GmbH, and Inspekto A.M.V. Ltd. Each player is profiled by patent holdings, technology focus, and market reach. For example, Keyence leads in compact high-speed inspection systems, Cognex specializes in AI-enhanced image processing, and Omron emphasizes integrated production line automation. The report also maps collaboration networks, showing how strategic alliances and joint R&D programs are accelerating innovation and broadening global market presence.
Overall, the report provides a comprehensive view of the visual inspection systems industry—from patent and market trends to competitive dynamics and technological priorities. Each section interlinks to present a cohesive understanding of the state and future direction of visual inspection science and commercialization. By blending patent data, market insights, and in-depth analysis of key technologies and players, the report functions as an essential guide for stakeholders in R&D, manufacturing, policy-making, and investment who aim to leverage advancements in visual inspection for competitive advantage.
O que você receberá:
200+ Pages PDF Full Report
Slides em PDF com mais de 40 páginas
Arquivo Excel de cada figura incluindo dados estendidos
Pessoas que podem estar interessadas no relatório:
Chief Technology Officer
Profissionais de desenvolvimento de negócios
Executivos de Estratégia Corporativa
Oficiais de P&D e Inovação
Analistas de Investimentos
Gerentes de produto
Manufacturing Directors
Quality Assurance Managers
Vice President – Engineering
Vice President – Operations
Heads of Manufacturing
Analistas
Profissionais de Planejamento Corporativo
Industrial Automation Experts
Market Intelligence Specialists
Chefes de Inovação
Chefes de Estratégia
Diretores de Operações
Analistas de negócios
Factory Automation Consultants
Acadêmicos





Avaliações
Ainda não há avaliações.